About Aspecto
Aspecto is a platform made for developers, laser-focused on building the best observability and distributed tracing experience possible.
Aiming to bring developers complete visibility into every interaction, performance issue, and error happening within their distributed services.
Aspecto steps above the traditional logs and helps developers to use much more accurate, granular and visual data when debugging new code or trying to improve software performance. Using Aspecto to leverage OpenTelemetry and effectively investigate production helps keep the users engaged and saves R&D previous time.
Developer friendly and easy to use.
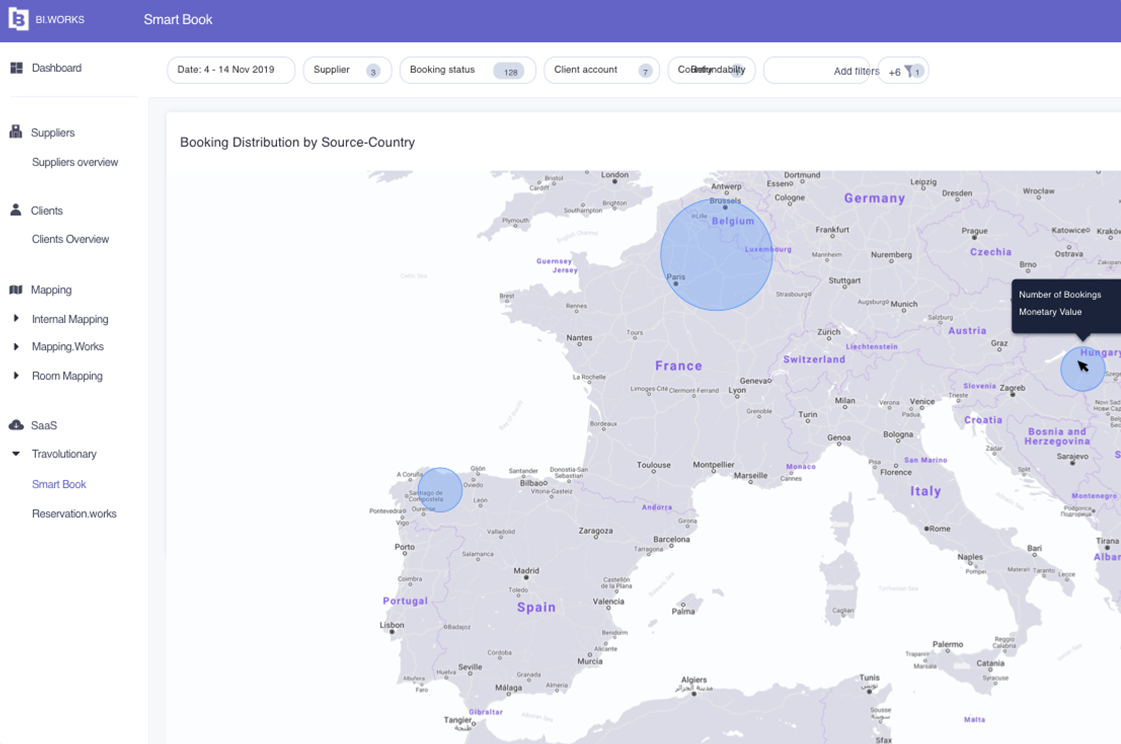
From anywhere to everywhere
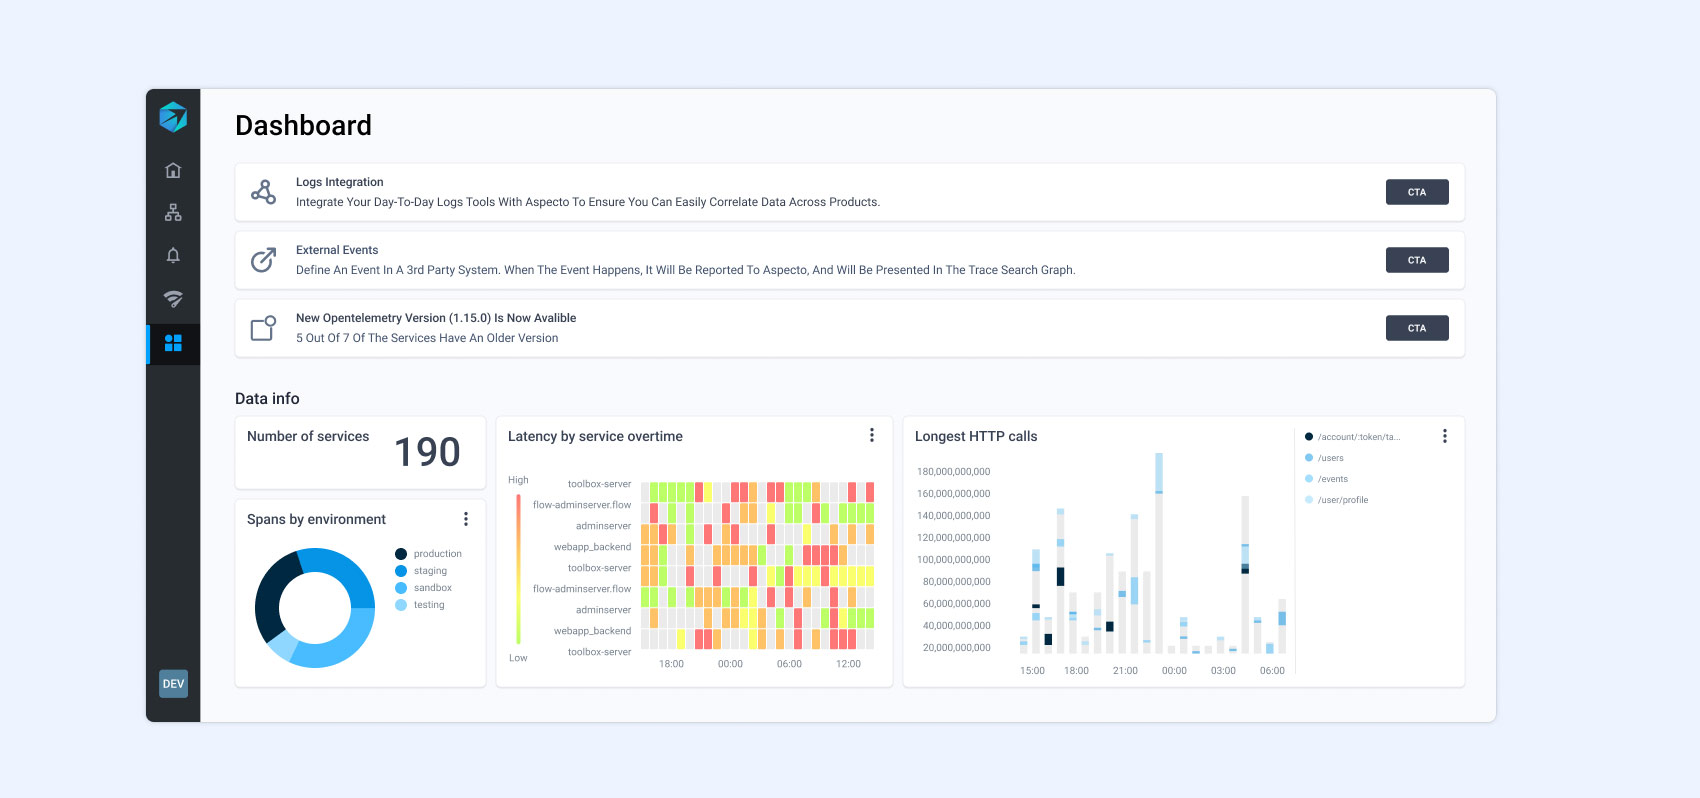
The key objective was to make a vast amount of data easily accessible and comprehensible from all corners of the platform.
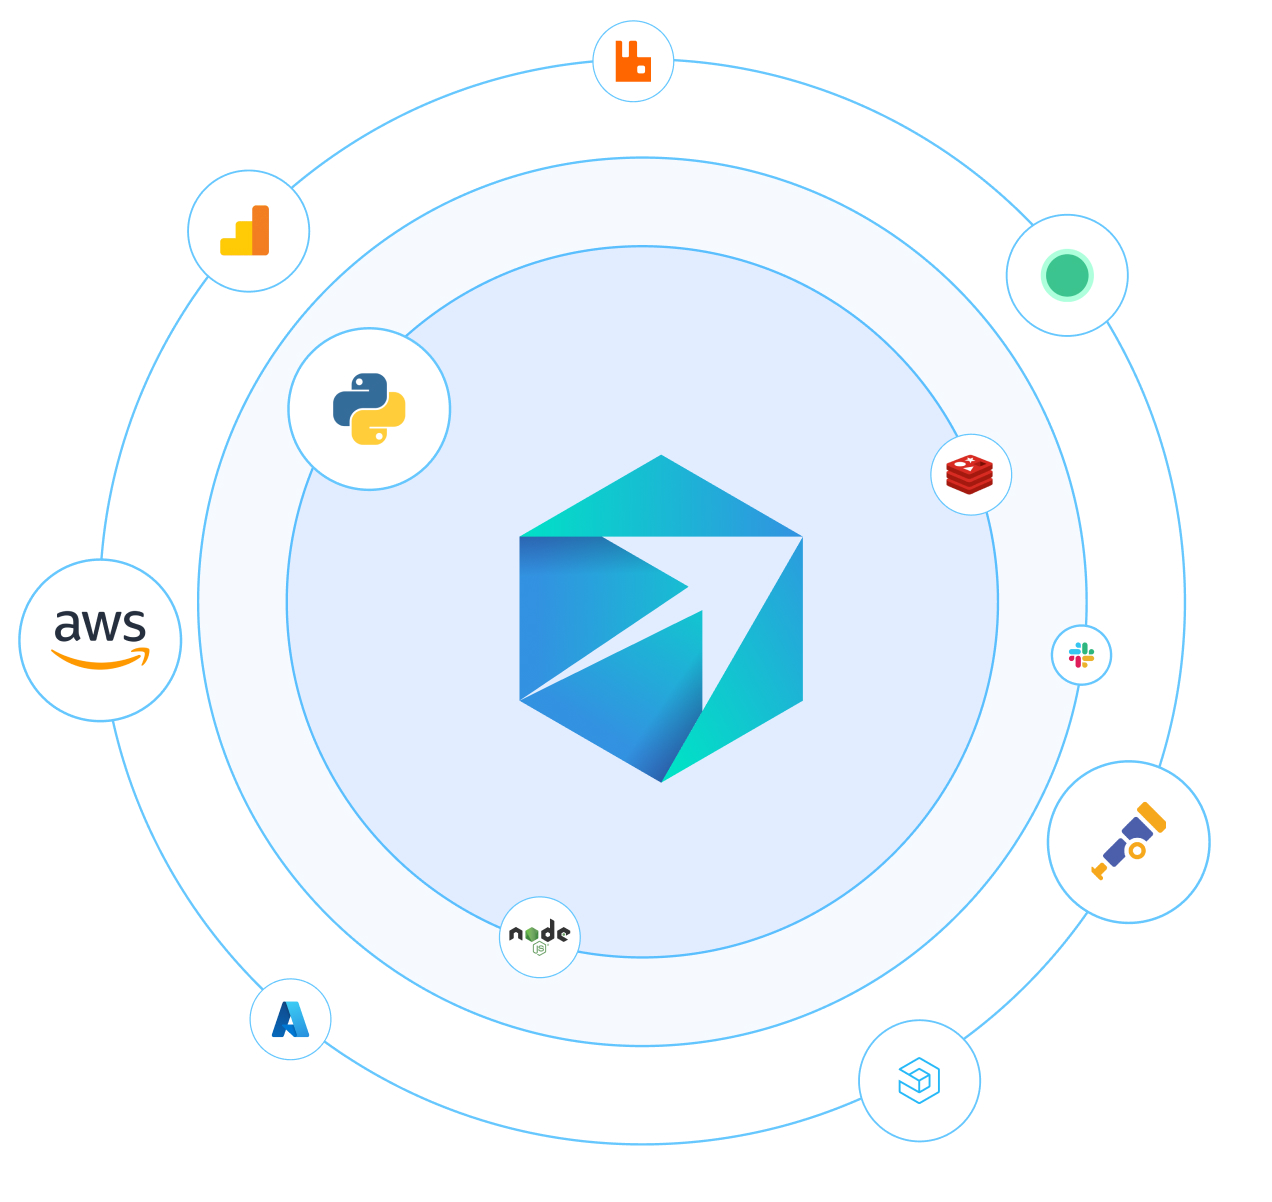
Our role was to ensure that every piece of information could be seamlessly accessed and understood by developers. The platform's big data nature required a careful balance between clarity and functionality. Through meticulous design, we aimed to create a user experience that enabled developers to effortlessly navigate and explore the wealth of granular and visual data provided by Aspecto. The challenge was not only to present the data in a comprehensive manner but also to maintain a developer-friendly and intuitive interface.
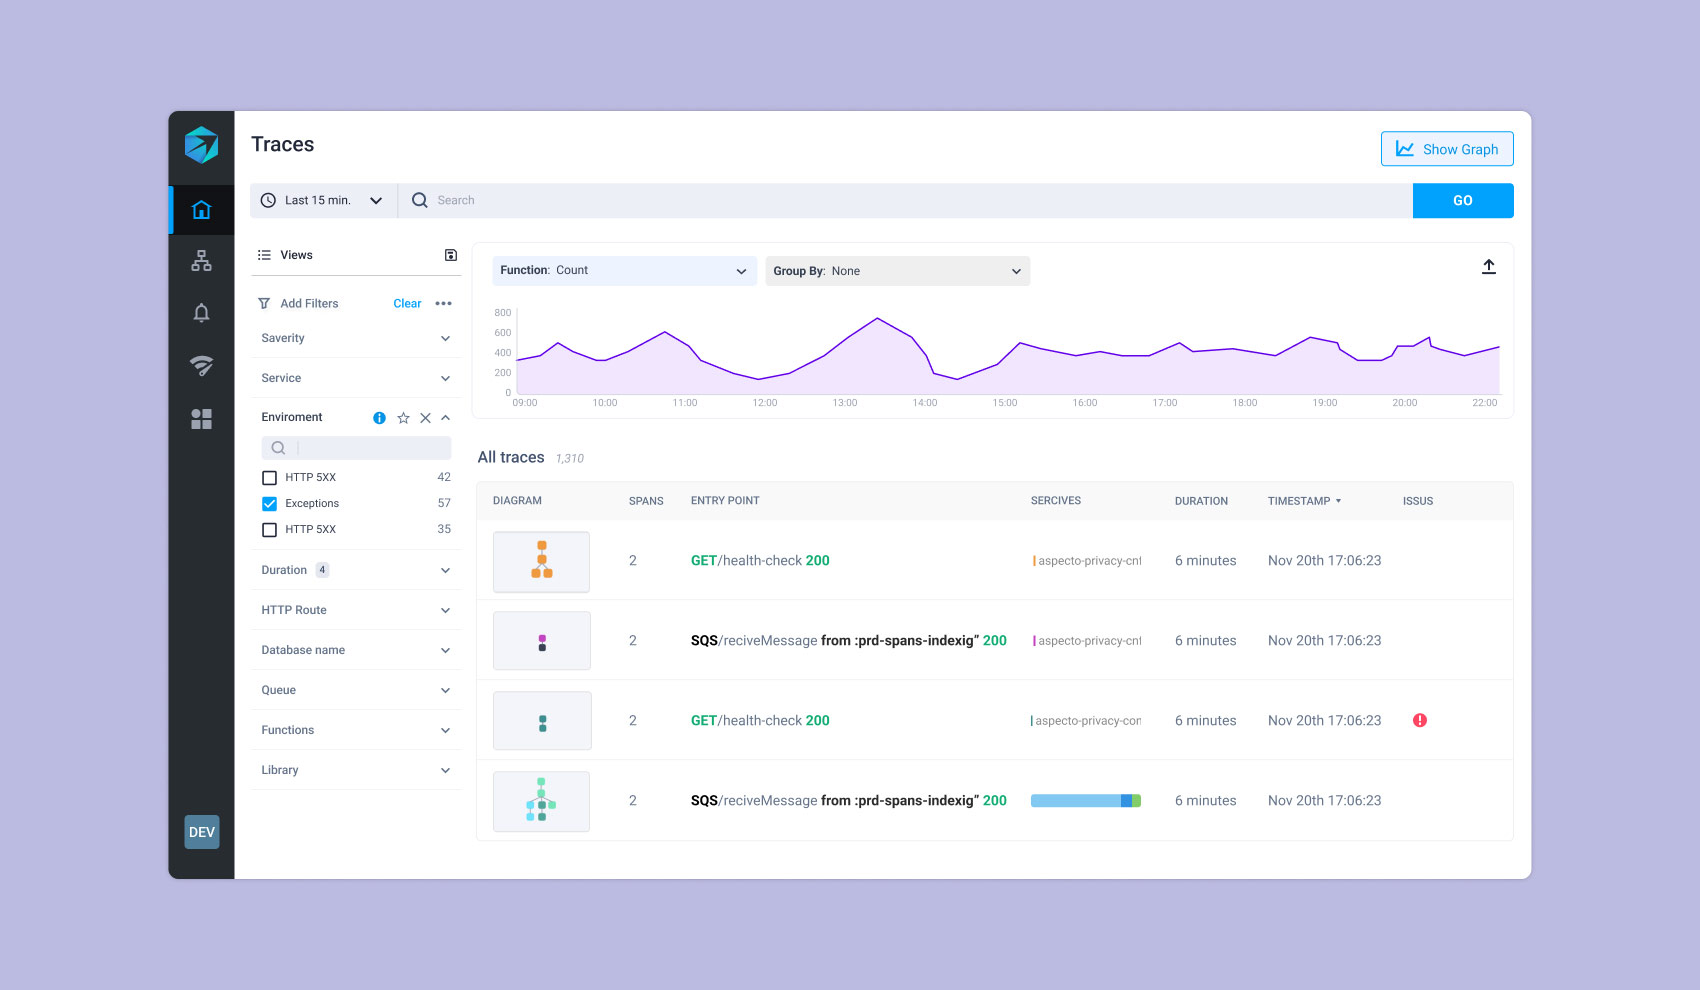
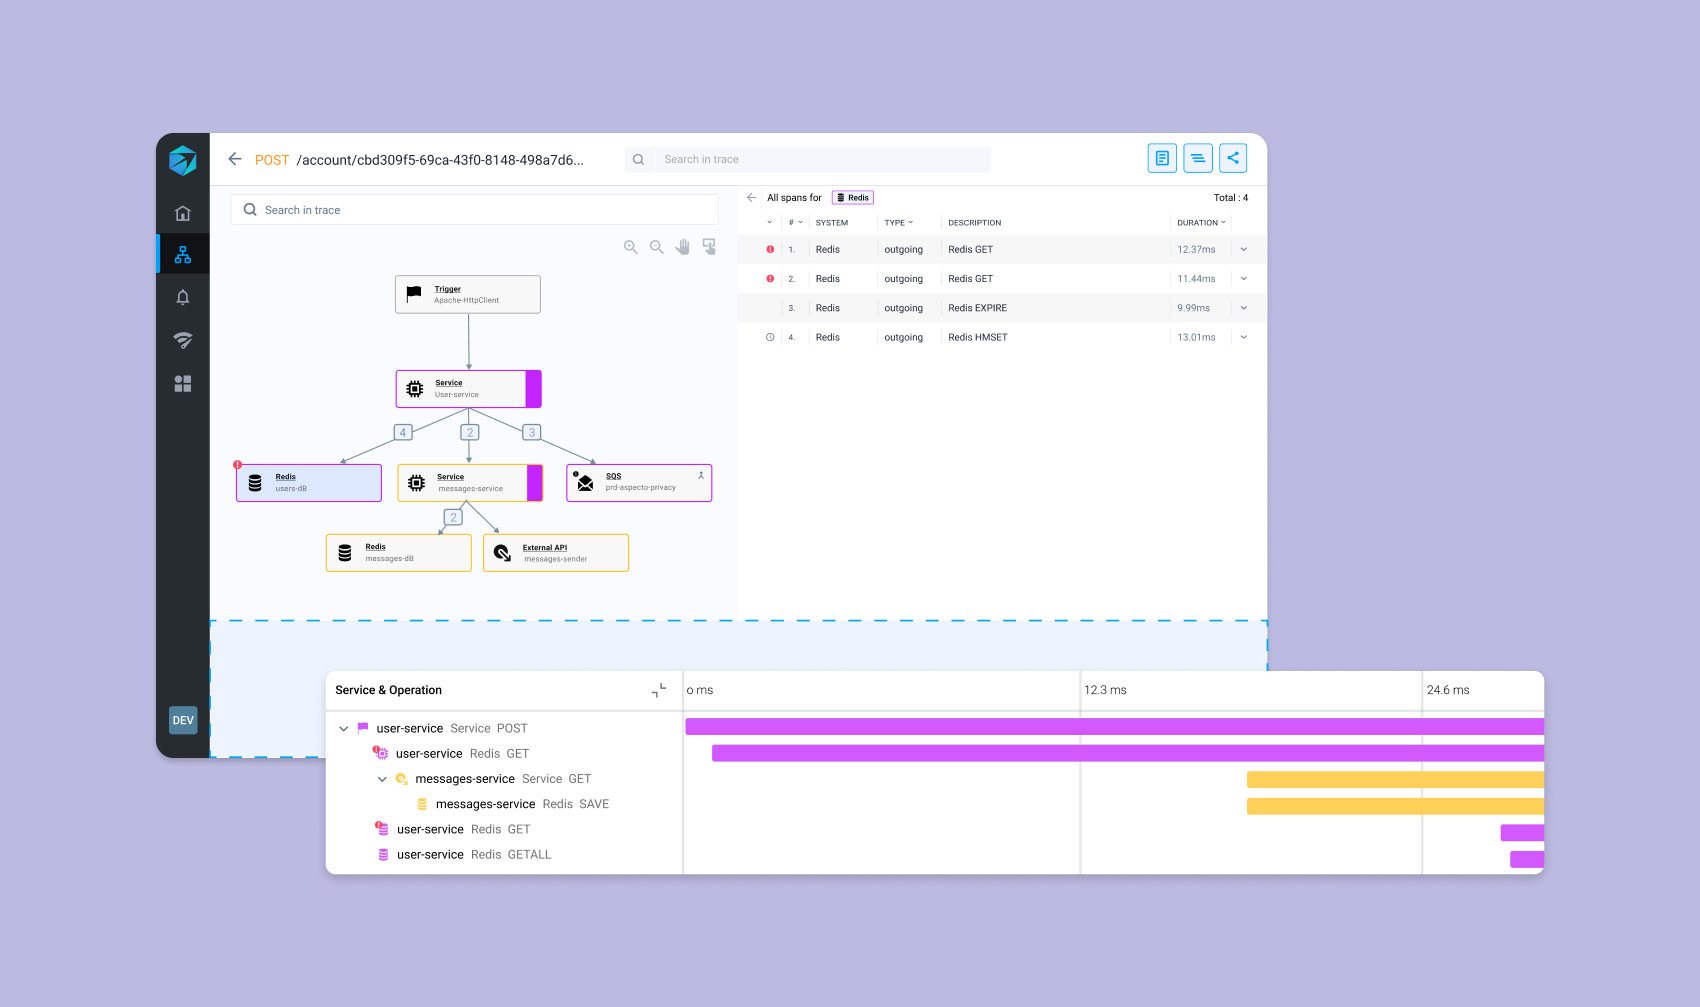
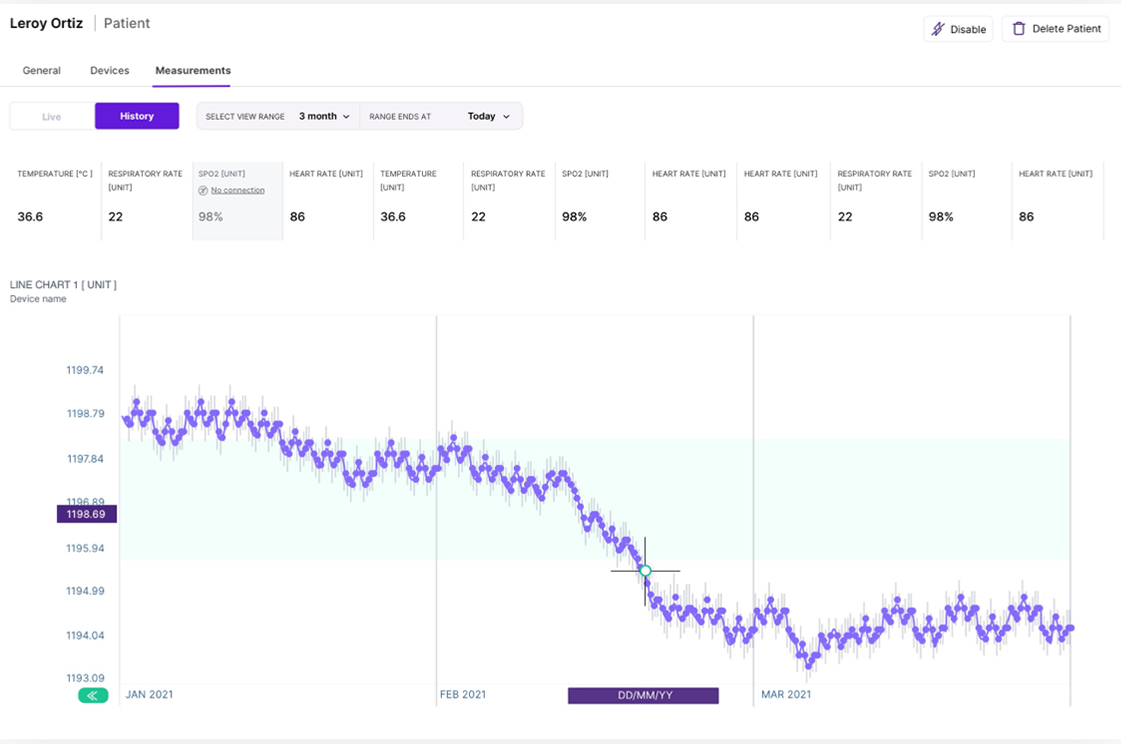
Data visualization
Designing Aspecto's platform presented us with the challenge of creating a multitude of graphs and data visualizations throughout the system. Our goal was to provide developers with a comprehensive understanding of their distributed services, interactions, performance issues, and errors. This required us to design various types of data visualizations that accurately represented the relevant data at any given moment.
To overcome this challenge, we adopted a systematic approach. We began by conducting extensive research to understand the needs and preferences of developers when it came to data visualization. This helped us identify the most effective visualization techniques and determine the appropriate data points to display in each graph or diagram.
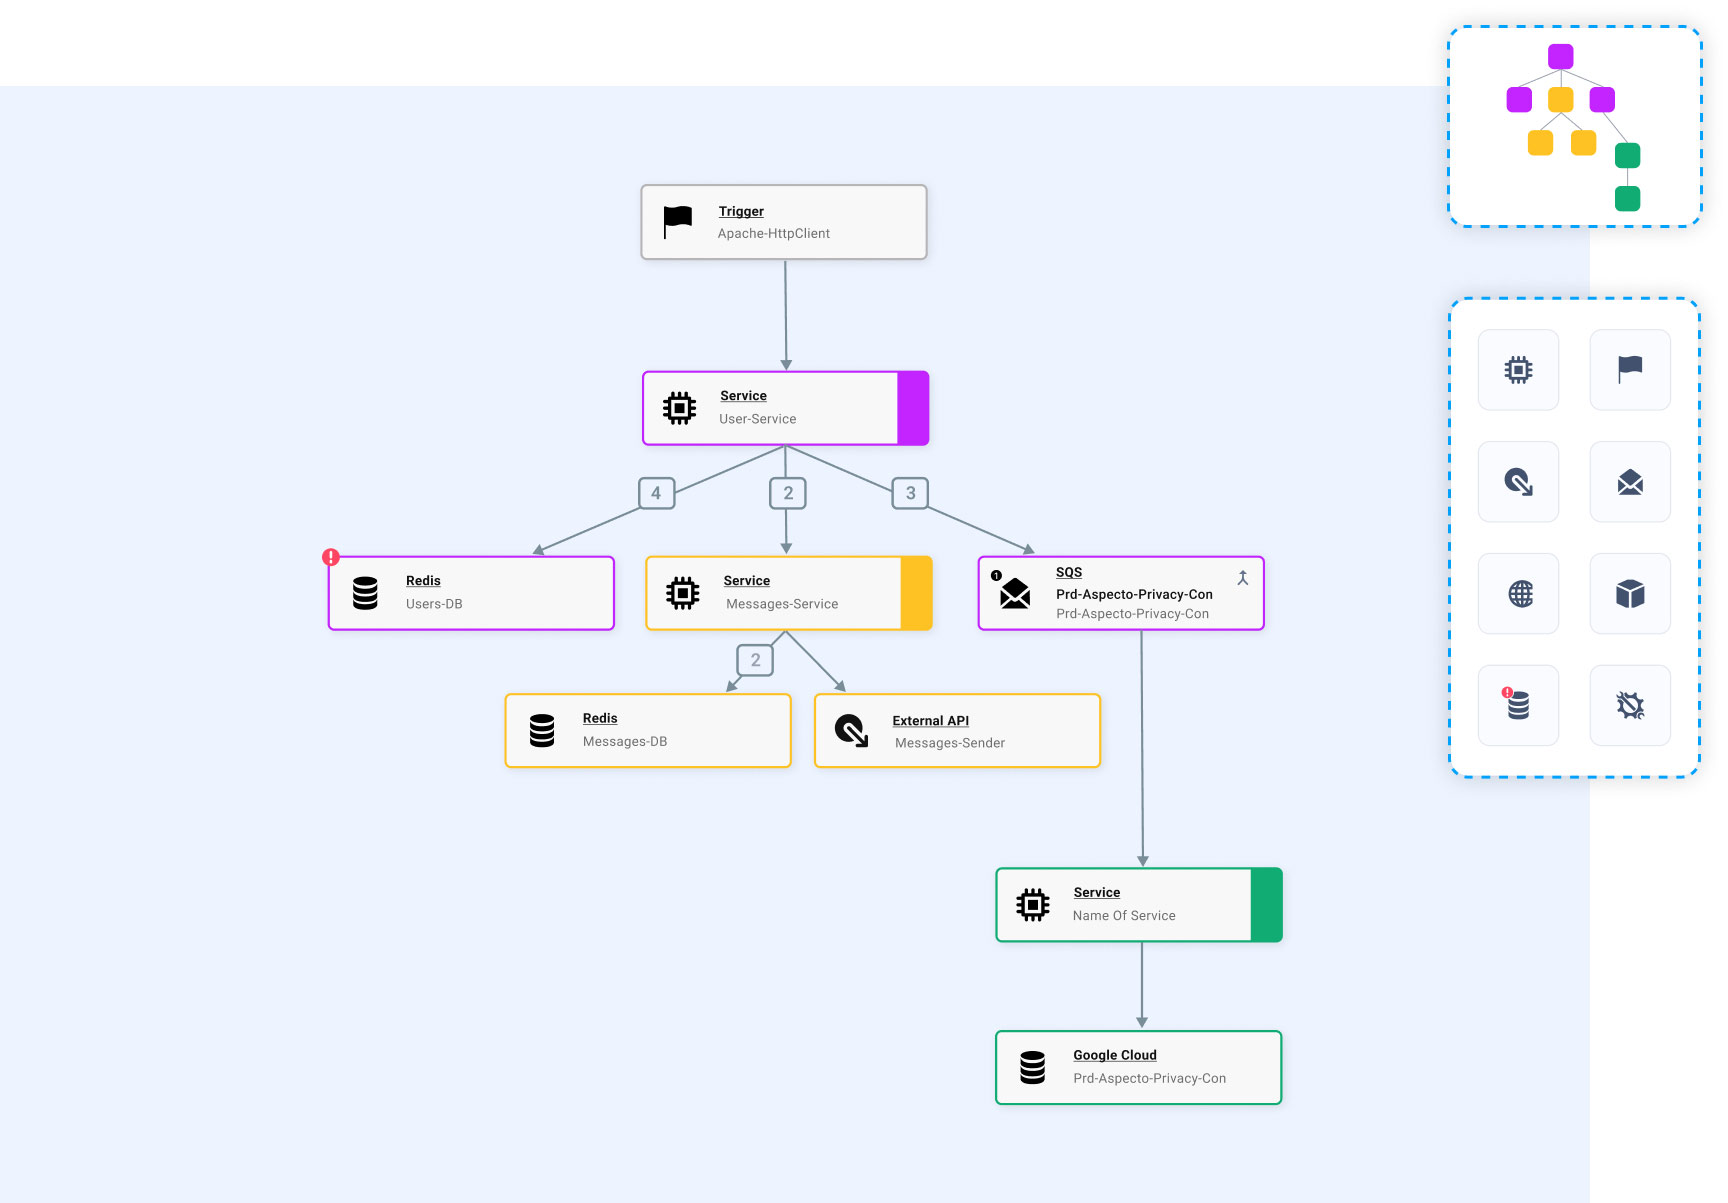
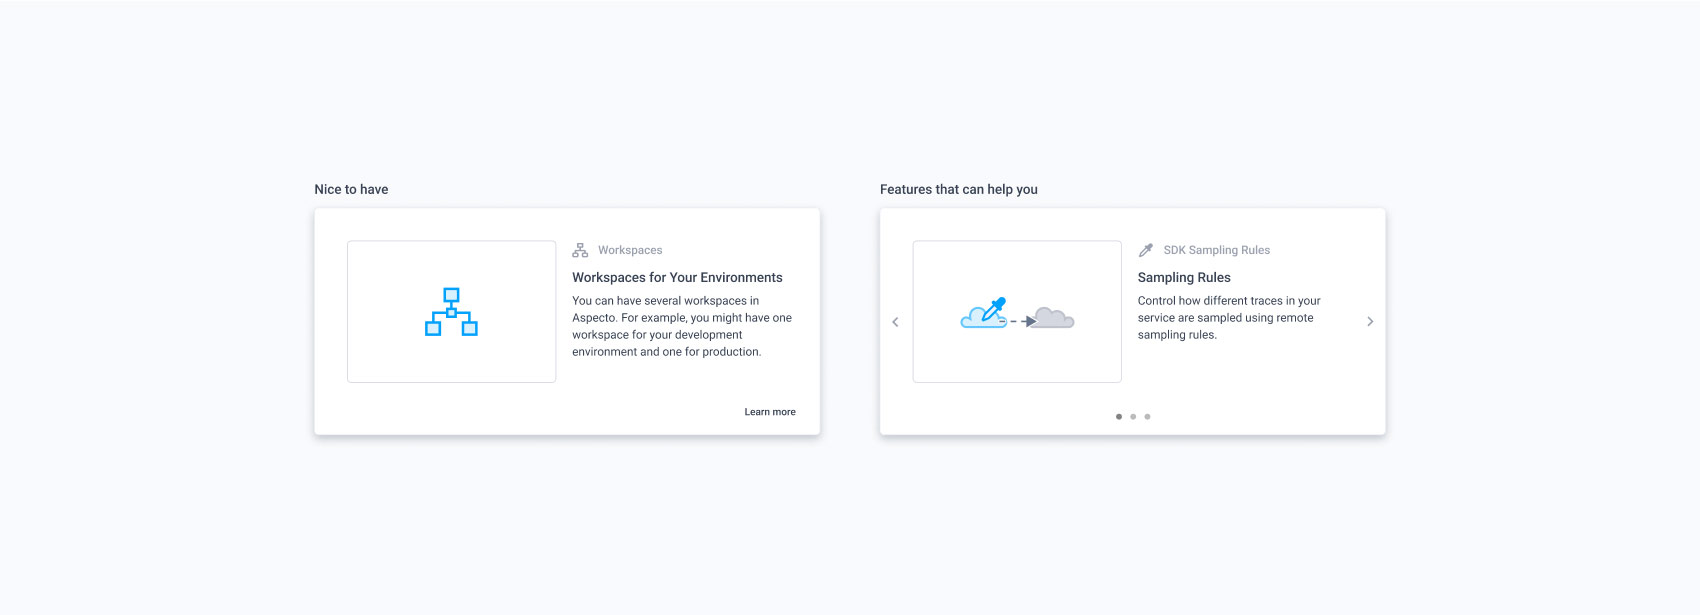
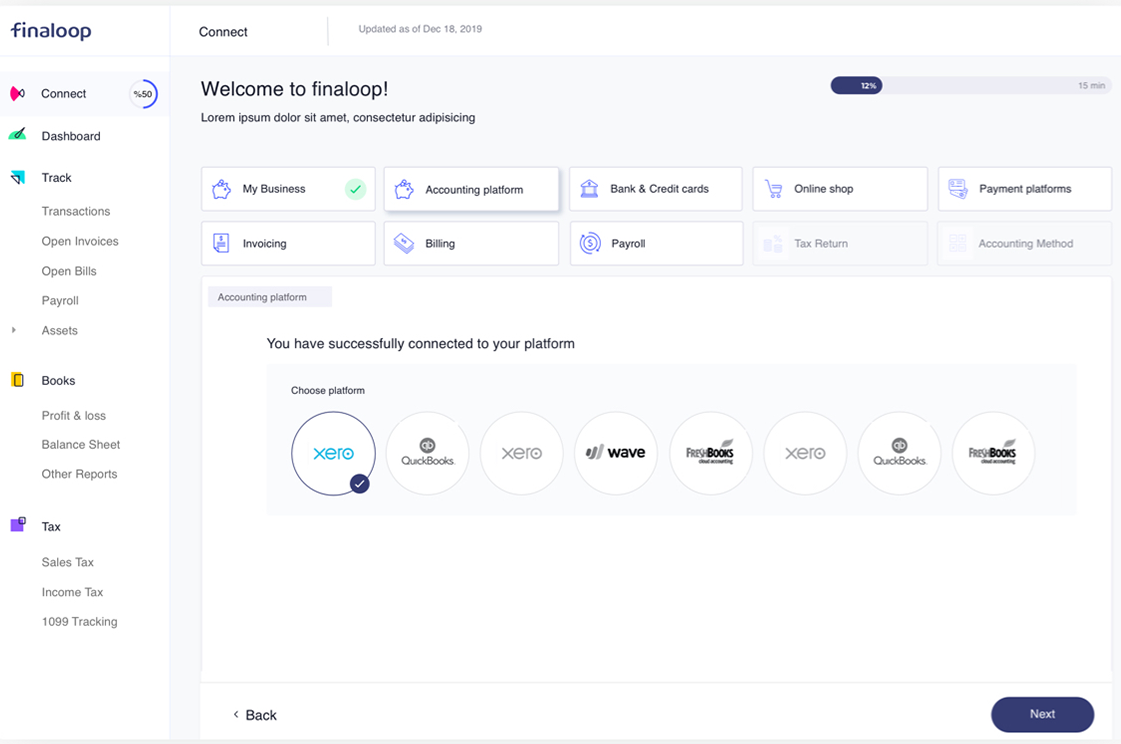
Next, we created a design system that ensured consistency and cohesiveness across all visualizations.
This design system included standardized colors, typography, iconography, and layout guidelines. By maintaining a consistent visual language, we were able to enhance the user experience and make the platform more intuitive for developers.
We also made sure to incorporate feedback from developers who used the platform during the design process, ensuring that their perspectives were considered.
Contact us to learn more about how our strategic design can optimize your company’s vision!

 in Tel Aviv